
Cross-Regime Evaluation of a Dynamic Asset Allocation System
A historical evaluation of OPEX Intelli’s dynamic allocation approach across major market regimes and conventional portfolio benchmarks.
Historical simulation · Technical research · Version 1.0
Historical simulated results.
The selected research candidate, labelled “Corrected recovery” in the supplied figures, was evaluated over 3 January 2007–31 December 2025. This version was evaluated in a subsequent research round and is presented alongside the original baseline.
- CAGR
- 11.18%
- Sharpe ratio
- 0.748
- Maximum daily drawdown
- 22.28%
- Annualized volatility
- 13.39%
Nominal U.S. dollar results after assumed execution costs, before investor-level management fees, performance fees and taxes. Sharpe uses daily excess returns over the study’s approximate Treasury-bill cash proxy. Maximum drawdown is reported as the magnitude of peak-to-trough loss.
Return in the context of risk.
The same principal period underlies these daily-frequency comparisons. The original OPEX baseline is included to make the later candidate’s historical improvement visible.
| Portfolio | CAGR | Volatility | Sharpe | Max daily drawdown |
|---|---|---|---|---|
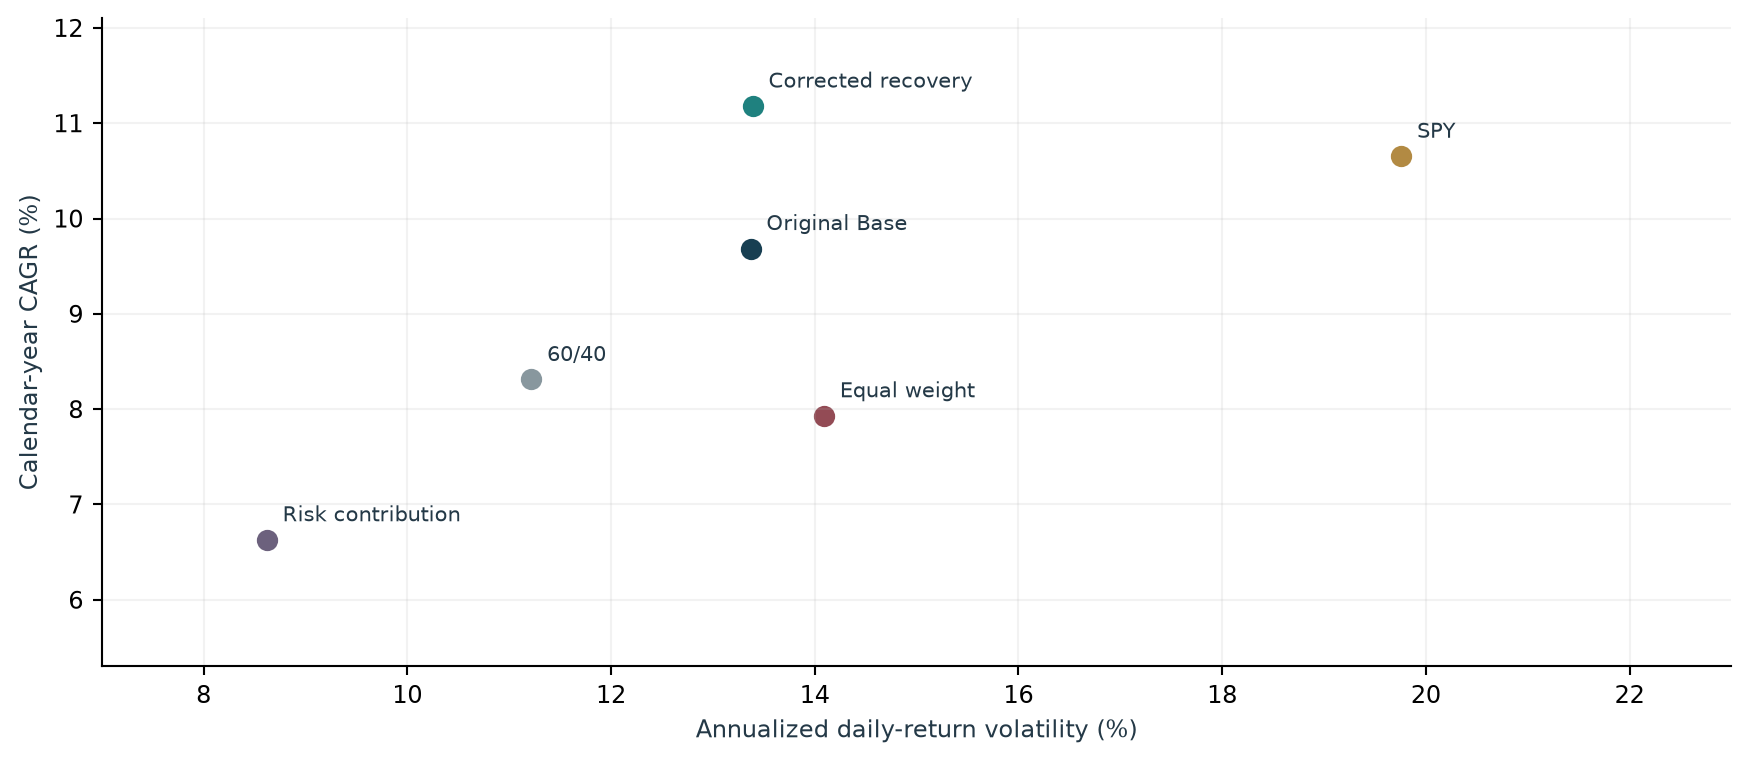
| OPEX — selected candidate | 11.18% | 13.39% | 0.748 | 22.28% |
| OPEX — original baseline | 9.68% | 13.37% | 0.648 | 26.18% |
| SPY / broad U.S. equities | 10.65% | 19.76% | 0.536 | 55.19% |
| 60/40 SPY–TLT | 8.31% | 11.22% | 0.635 | 31.09% |
| Equal weight | 7.93% | 14.09% | 0.507 | 41.34% |
| Equal risk contribution | 6.63% | 8.62% | 0.615 | 21.20% |
SPY represents broad U.S. equities. The 60/40 comparator combines U.S. equities and long-duration U.S. Treasuries, rather than a global stock / aggregate-bond portfolio. Equal weight and equal risk contribution are multi-asset conventional benchmarks; the latter represents a risk-parity category.
01 / Risk-adjusted resultsThe selected candidate’s historical Sharpe is higher than the four conventional benchmarks shown. Statistical significance and prospective outperformance are not established.
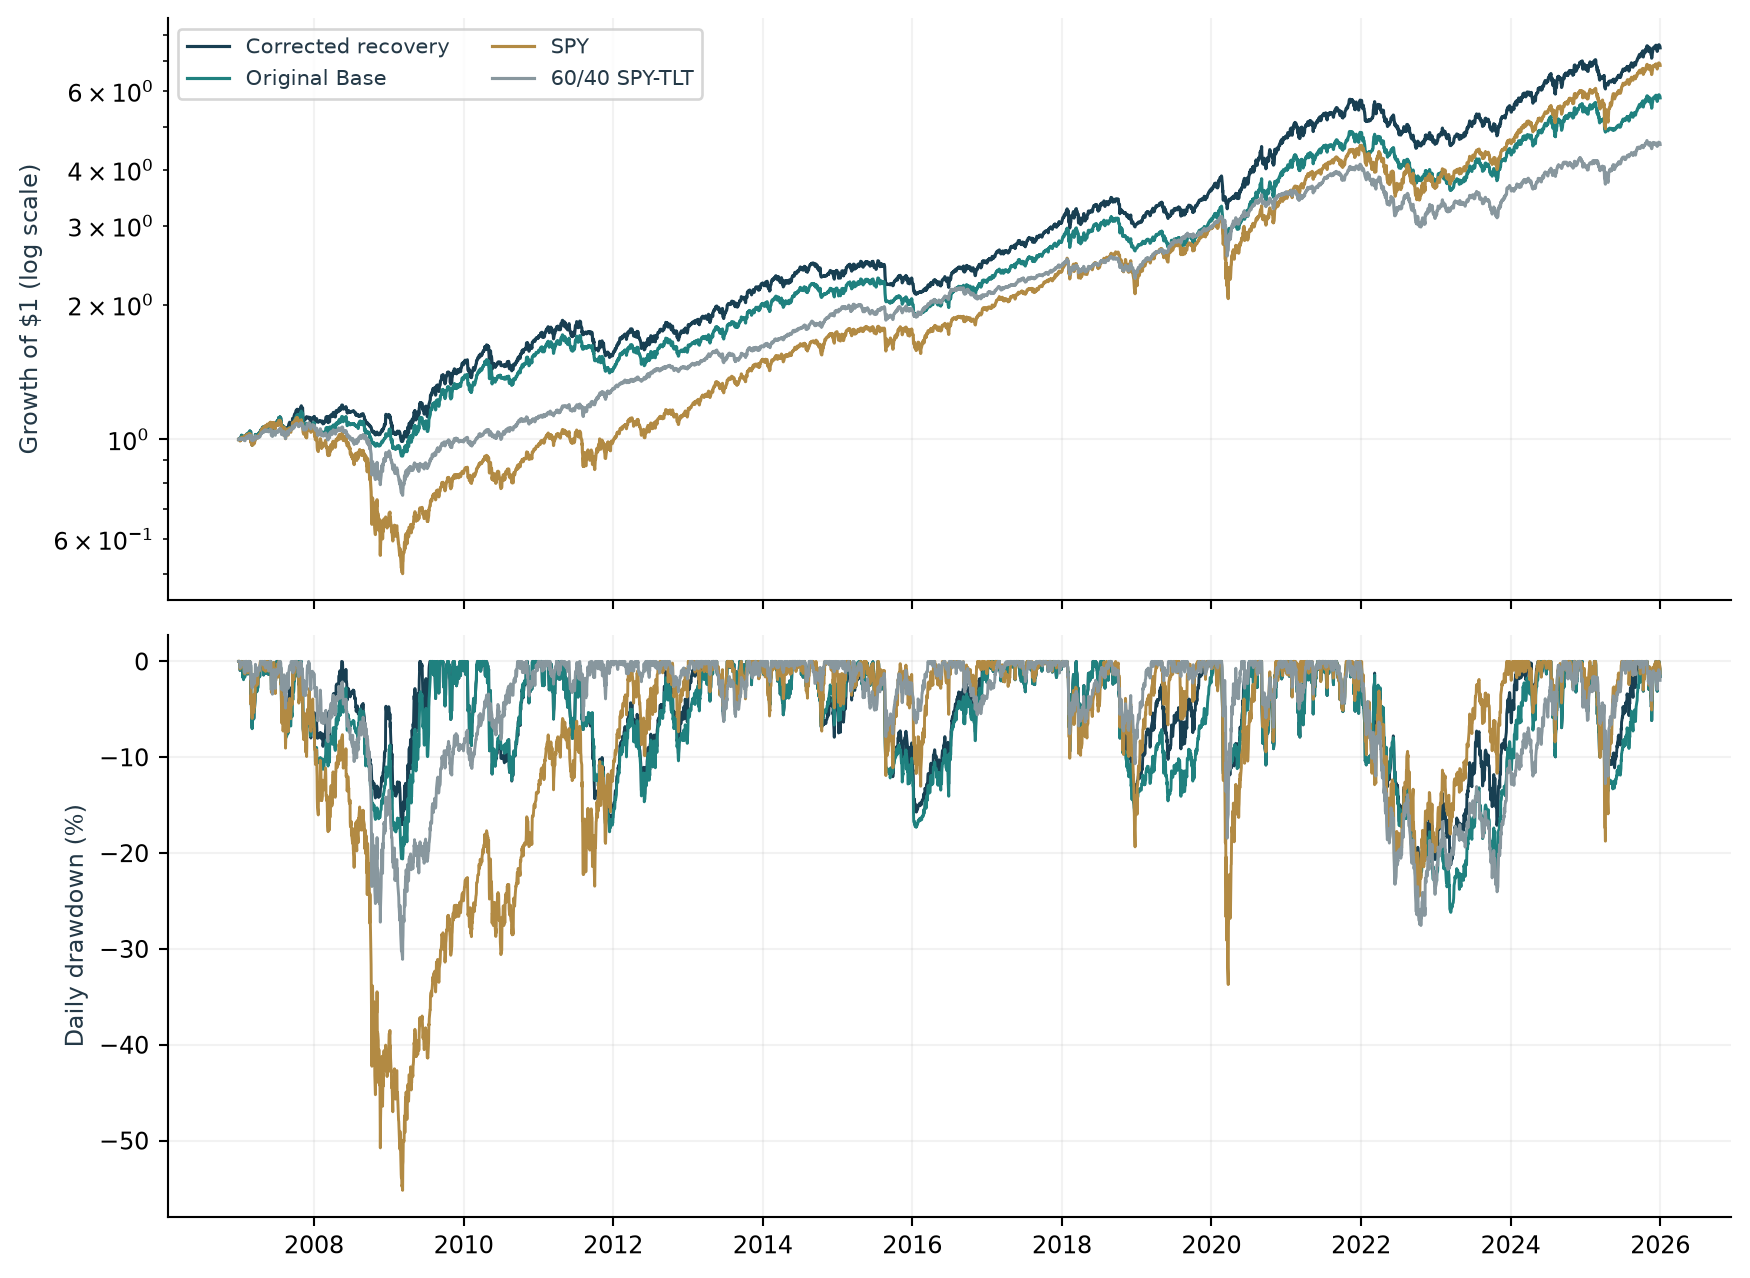
02 / Downside trade-offIts maximum daily drawdown is lower than SPY and 60/40, but higher than equal risk contribution. Losses remain material.
03 / Uneven behaviorThe original baseline’s CAGR is lower than SPY. The selected candidate does not improve every market environment.
Three views of the historical record.
Growth and drawdown
Investment wealth and daily losses from a prior peak, shown together.
Risk versus return
Compound growth alongside annualized daily-return volatility.
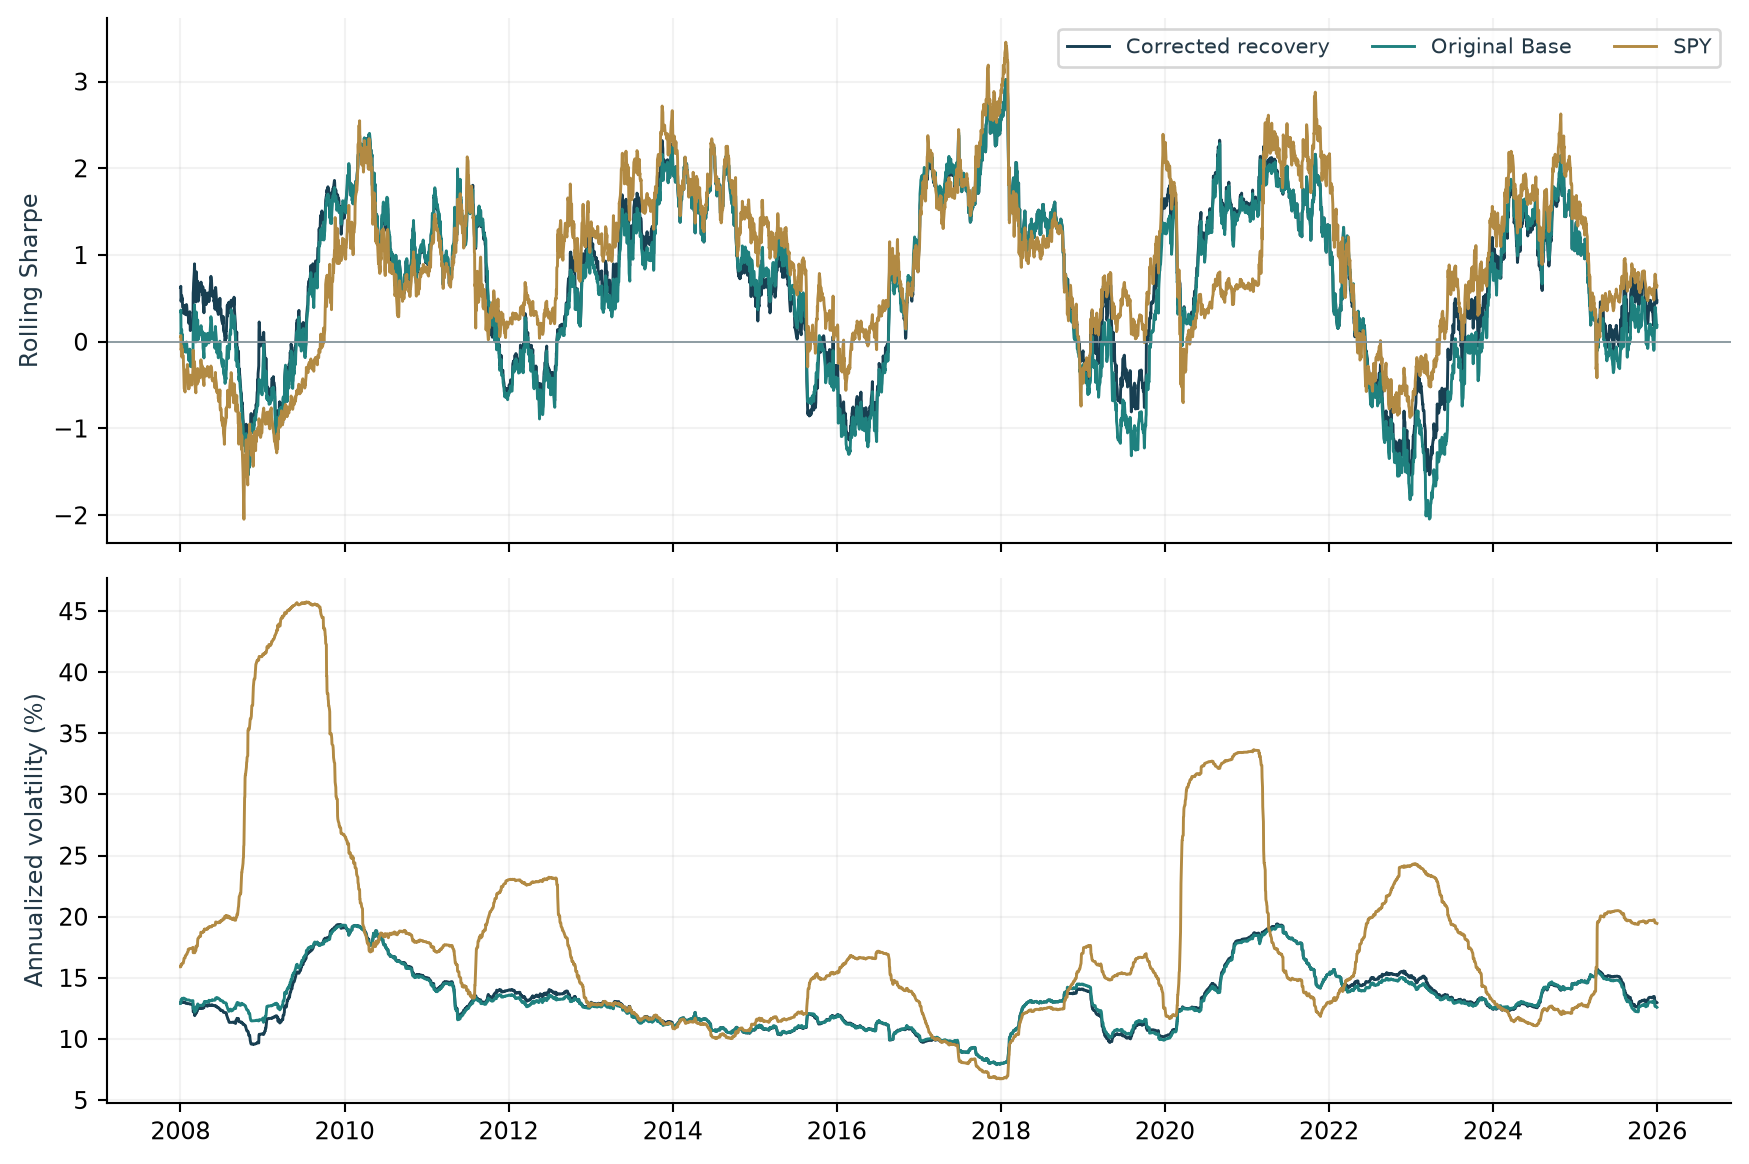
Risk through time
A full-period average conceals changing market conditions.
Open any figure for the full-resolution version. Figures are supplied by OPEX Intelli in Research 001, version 1.0.
Historical evidence.
Ongoing research.
OPEX Intelli was evaluated using historical market data across multiple market regimes and compared against conventional portfolio benchmarks under simulated execution assumptions.
The evaluation considered risk-adjusted performance, drawdown, volatility, transaction costs and regime behavior. Broad exposures included equities, government bonds, real estate equities and commodities.
Certain elements of the system are proprietary and are not disclosed publicly.
Results vary across environments
The selected candidate recorded negative annualized growth during both the early-2020 COVID shock and the 2022–2023 inflation and tightening period. Its risk-adjusted results weakened in some environments relative to an earlier candidate. A stronger full-period score does not establish universal resilience.
Research status
This is a curated summary of an OPEX Intelli technical research report. It is not a peer-reviewed publication or a prospective validation. The reported paired Sharpe improvement over the earlier recovery candidate is statistically inconclusive under the study’s unadjusted bootstrap interval.
What this evidence can establish.
- Results are simulated. Backtests are not live investment performance.
- Historical results do not guarantee future performance.
- Execution assumptions, transaction costs, liquidity and actual fills affect outcomes. Capacity and market impact have not been established.
- Historical data informed both development and evaluation, which can make results look stronger than they would on new data. The study does not include an untouched holdout period.
- Market-data adjustments and the approximate cash proxy carry source limitations; they are not independently certified market data.
- The evaluation does not constitute investment advice or an offer of investment services.
Prospective testing and an independently assessed live record remain necessary before drawing conclusions about deployable performance.